Let’s talk Wireshark. We all pretty much know what Wireshark is and it’s functionality but how well can you navigate around in your PCAPs? Do you truly understand what’s happening over your network? Or does it just look like a bunch of gibberish to you? Hopefully I can help you gain a better understanding of the functionality Wireshark has to offer.
Filtering –
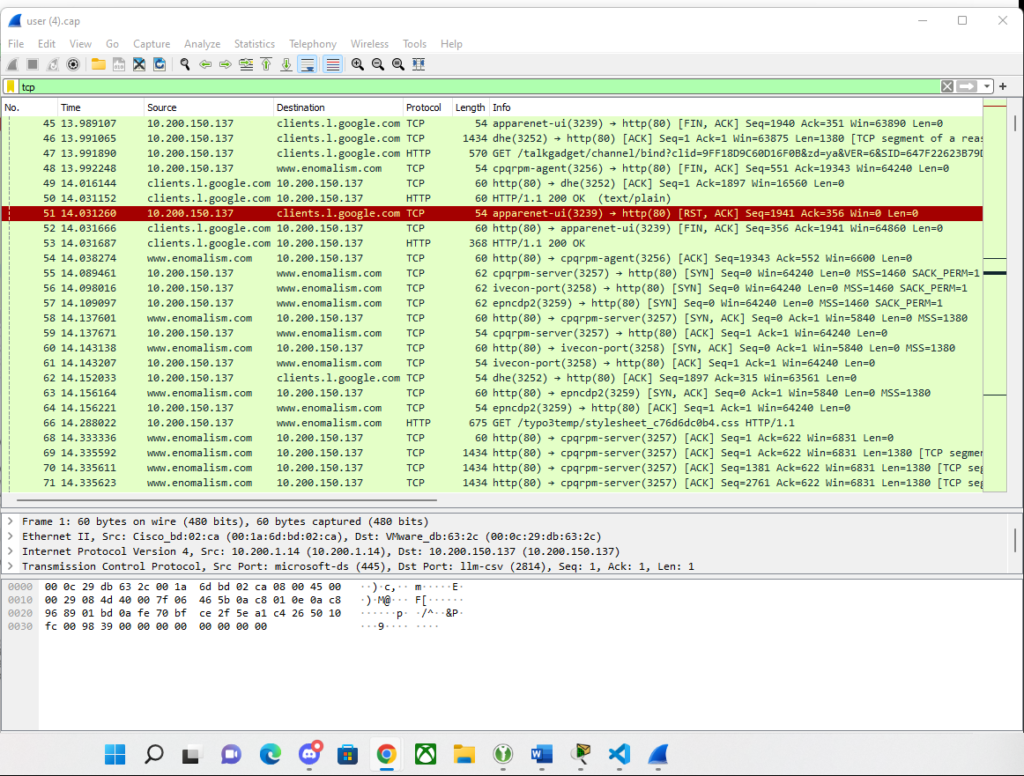
We can filter through various different protocols by typing into the filter pane. In this picture we've filtered out just the TCP packets and their replies from the server. This same thing can be done by typing in TCP,UDP, HTTP, RIP, and so on.
Important note : normally most of this traffic would be encrypted but since it was sent over HTTP it is visible in clear text.

Common Flags –
Common flags you'll see in the lifecycle of a TCP session are SYN, SYN/ACK and ACK . This occurs when the client or server are trying to communicate. They are basically saying "Hey I'm John, are you there Ron?", then Ron responds "Hey John, its Ron I'm here"  then the connection is established (ACK).

Once a TCP session is over you will see a "FIN" flag which represents the ending of the session which is followed by an ACK.
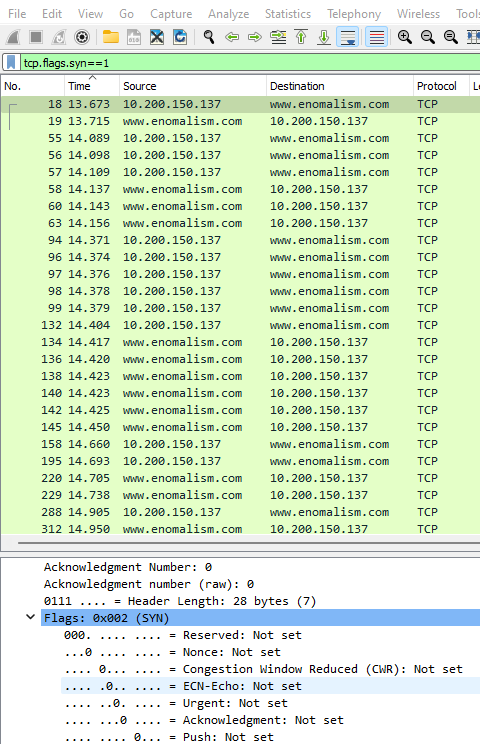
TCP dropdown > Flags drop down | Navigating here will display the flag that is being sent within the frame selected.

Great filtering techniques –
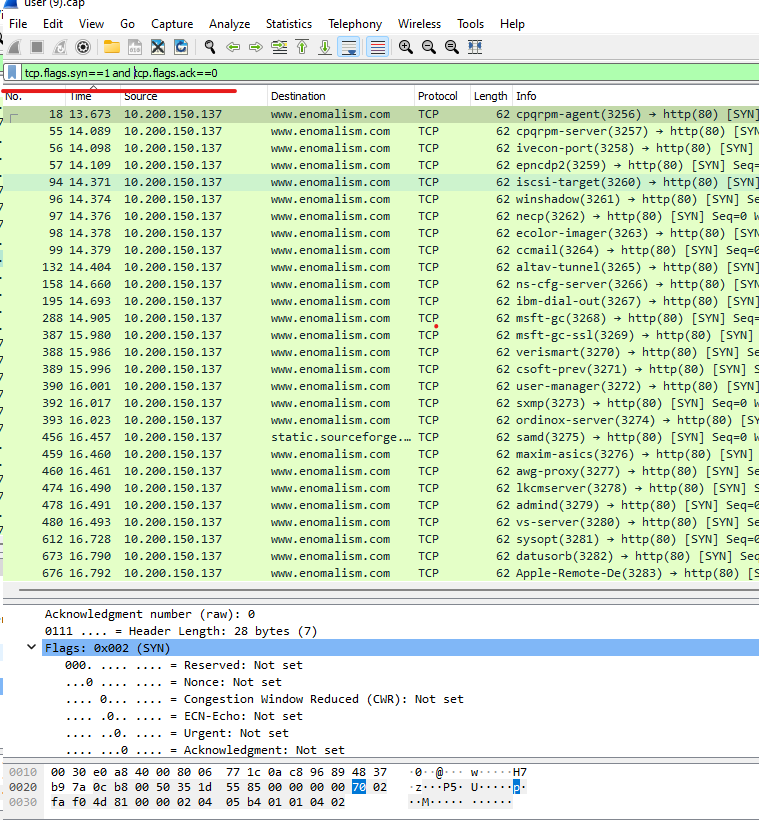
In regards to capturing solely your TCP three way handshake :tcp.flags.syn==1is a very useful filter because it will only show you SYN and SYN/ACK packets. From there you can start deciphering what came from where by looking at the source addresses and destination addresses. If you're just wanting to monitor how many call outs and call-ins you're getting you can also add onto that filer :tcp.flags.ack=0| You will now only see SYN flags from both the client and server.

Monitoring RTT time –
RTT is round trip time. This is the time that it takes to receive each frame from start to finish. Monitoring the RTT time of our frames is crucial to diagnosing network latency issues. This could be caused by a number of issues but the most common one is firewall rules. The more firewall rules in place, the more likely it is for the network to slow down due to all of the extra checks and balances.
The simplest way that I’ve found to monitor this in Wireshark is by changing our view settings to the following :
view > Time Display Format > Since Previous captured packet
view > Time Display Format > milliseconds


No responses yet