Project two had a lot of steps but became fairly easy as I learned how to navigate Microsoft Azure. I deployed a VM using Microsoft Azure prior to entering the log analytics workspace. I purposely left the RDP protocol open along with completely disabling the firewall to simulate live attacks.
This is the log analytics workspace in Azure. I’m going to use this to connect to our virtual machine along with “Microsoft Sentinel” in order to ingest the event logs to our SIEM.

I created the log analytics profile named “law-honeypot1” and connected it to my virtual machine that is also deployed in Microsoft Azure.

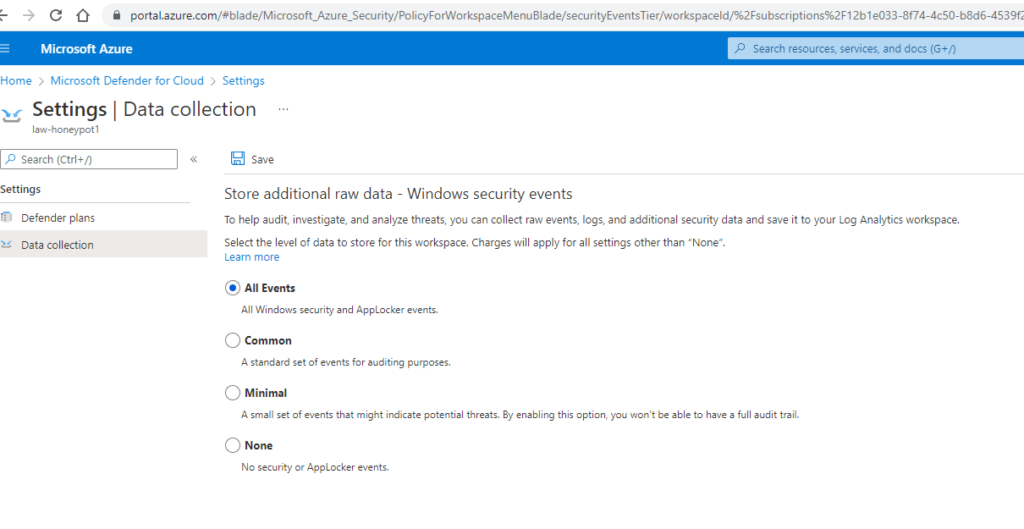
Here I configured the data collection parameters. This will tell our log analytics workspace to collect all event data from the windows event manager.
Using this third party website we’re able to take the IP addresses from the windows event manager that are flagged as a failed logon via RDP and convert that IP address into a geographical location. This will be automated by using the API key provided by the site and running a Powershell ICE script from Github.

Below is our PowerShell ICE script we downloaded from Github. This is the automation that will export the windows event logs to our SIEM on Azure. I inserted the API key inside the script in order to use my own account from the geolocation website I mentioned earlier.
https://github.com/joshmadakor1/Sentinel-Lab/blob/main/Custom_Security_Log_Exporter.ps1
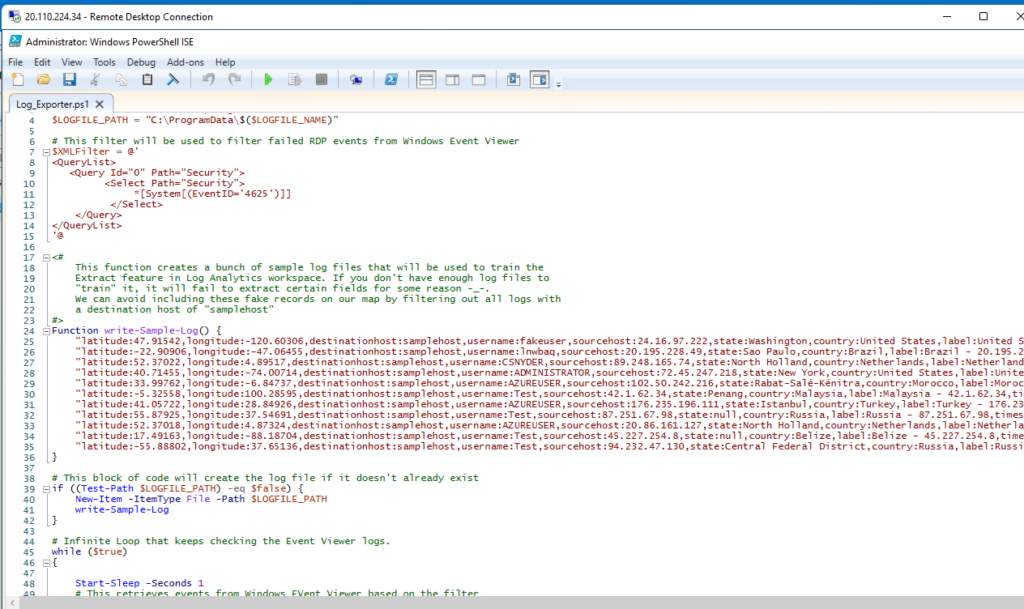
Wow! As soon as I ran the script we started seeing a number of failed logon attempts by an attacker in Indonesia. Now we need to get this information over to our log analytics workspace.

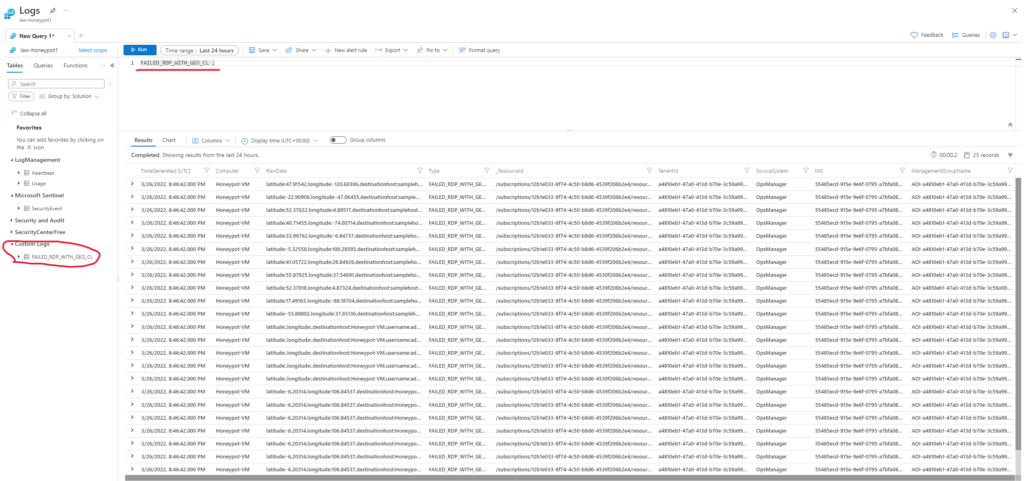
I then created a custom log by navigating to the custom log tab and entering in the exact same file path I used to run the PowerShell ICE script in order for the virtual machine to synchronize with the SIEM. You can also see that the data inside our SIEM is not at all as organized as it was on our virtual machine. I am going to change that using the custom fields feature.
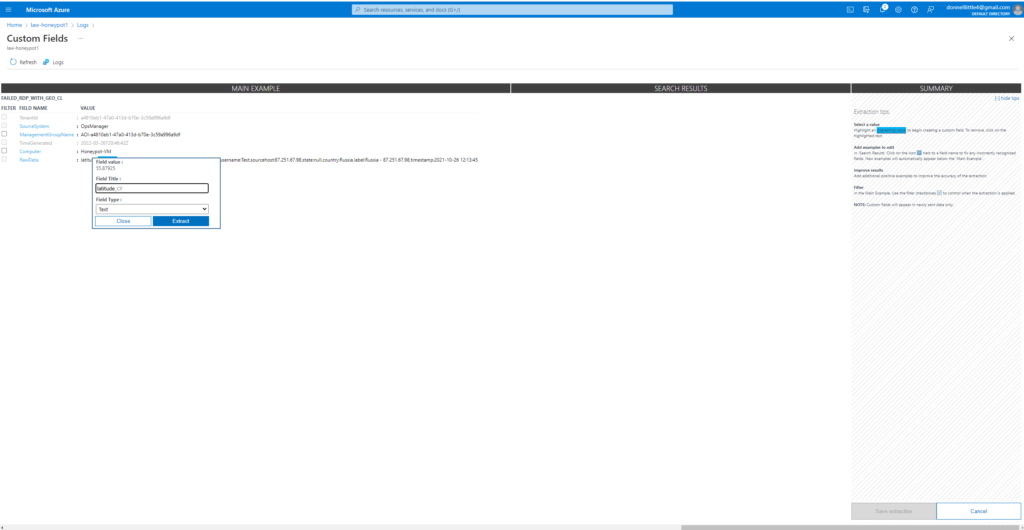
I’m using custom fields to essentially train the application on the types of data I want to categorize. Custom fields allows me to highlight certain values that are incorrect and remediate the query accuracy of the data that is being ingested. For example for latitude I want the latitude to display in the correct category properly because if it doesn’t our SIEM will have incorrect geodata if those fields are swapped.
This is the corrected log view after we adjusted all of our custom fields. Much more clear and concise now right?
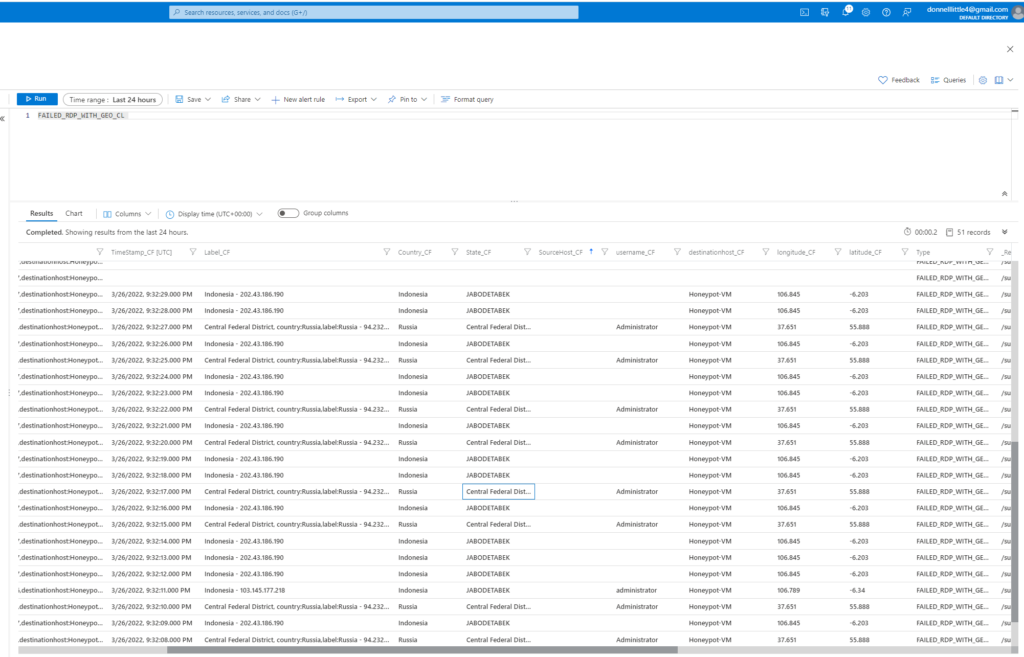
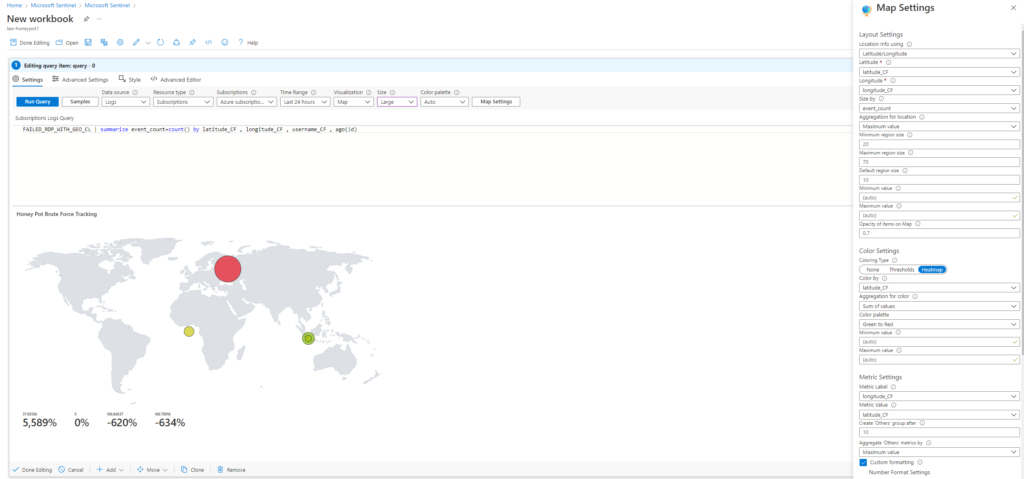
Inside of the SIEM we’re able to create a visualization and customize how we want our data displayed. This data from the logs are ingested into this heat map using Kusto Query. (which I’m really bad at)
My map didn’t turn out like it was supposed to. I’m going to have to do some more research on exactly the right code I need to write but it’s supposed to display the country of the attack and specific IP addresses associated with that country. In my example though, I did manage to get the map to reflect the areas the most attacks were coming from.


No responses yet